|
|
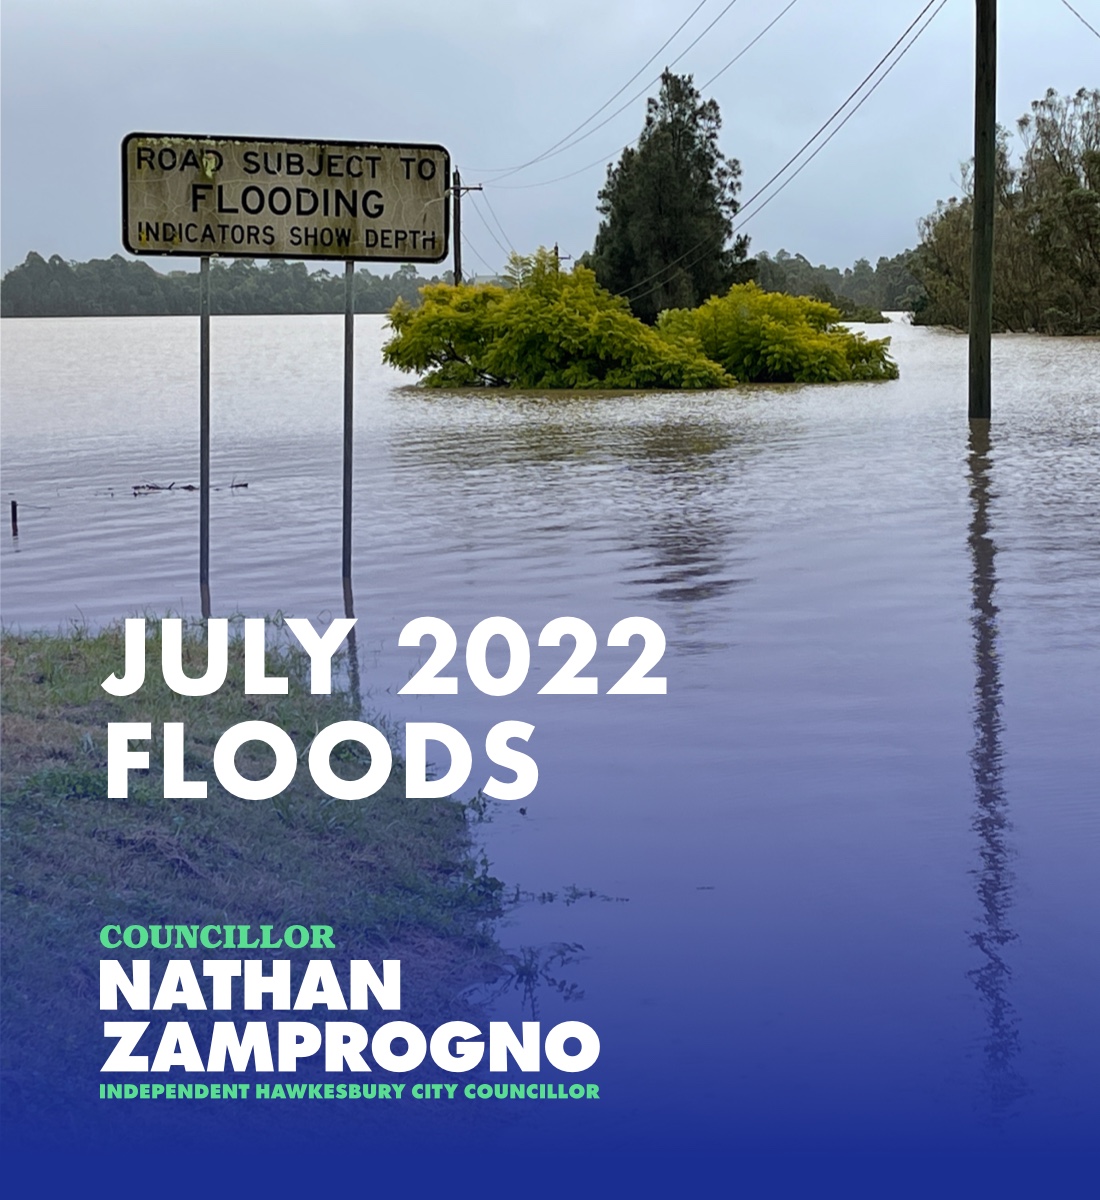
This week the Hawkesbury endured the worst flooding in 44 years.
|
The Windsor gauge topped 13.93m, beating both the March flood (13.71m) and the 2021 flood (12.91m). You would have to go back to 1978 (14.5m) to see one worse, while the 1867 flood was 19.6m. A "one in a hundred" flood is 17.3m, again as measured at Windsor.
|
I am reminded yet again how magnificently we stand by one another in times of trial. Our community is strong, and we will get through this together.
|
In this special flood edition of my newsletter I would like to present:
|
- A video record of the floodwaters as they hit their peak on Tuesday.
- A contribution to the important public debate we need have about how to respond to the increased risk of flooding, and to dispel some misunderstandings I see frequently, and
- A prescient video made by Sky News Weather less than a month ago warning of the dangers and likelihood of another serious flood.
My hope remains that you and your own families are safe .
|
|

|
|
Councillor Nathan Zamprogno
|
|
|
|
|
|
|
|
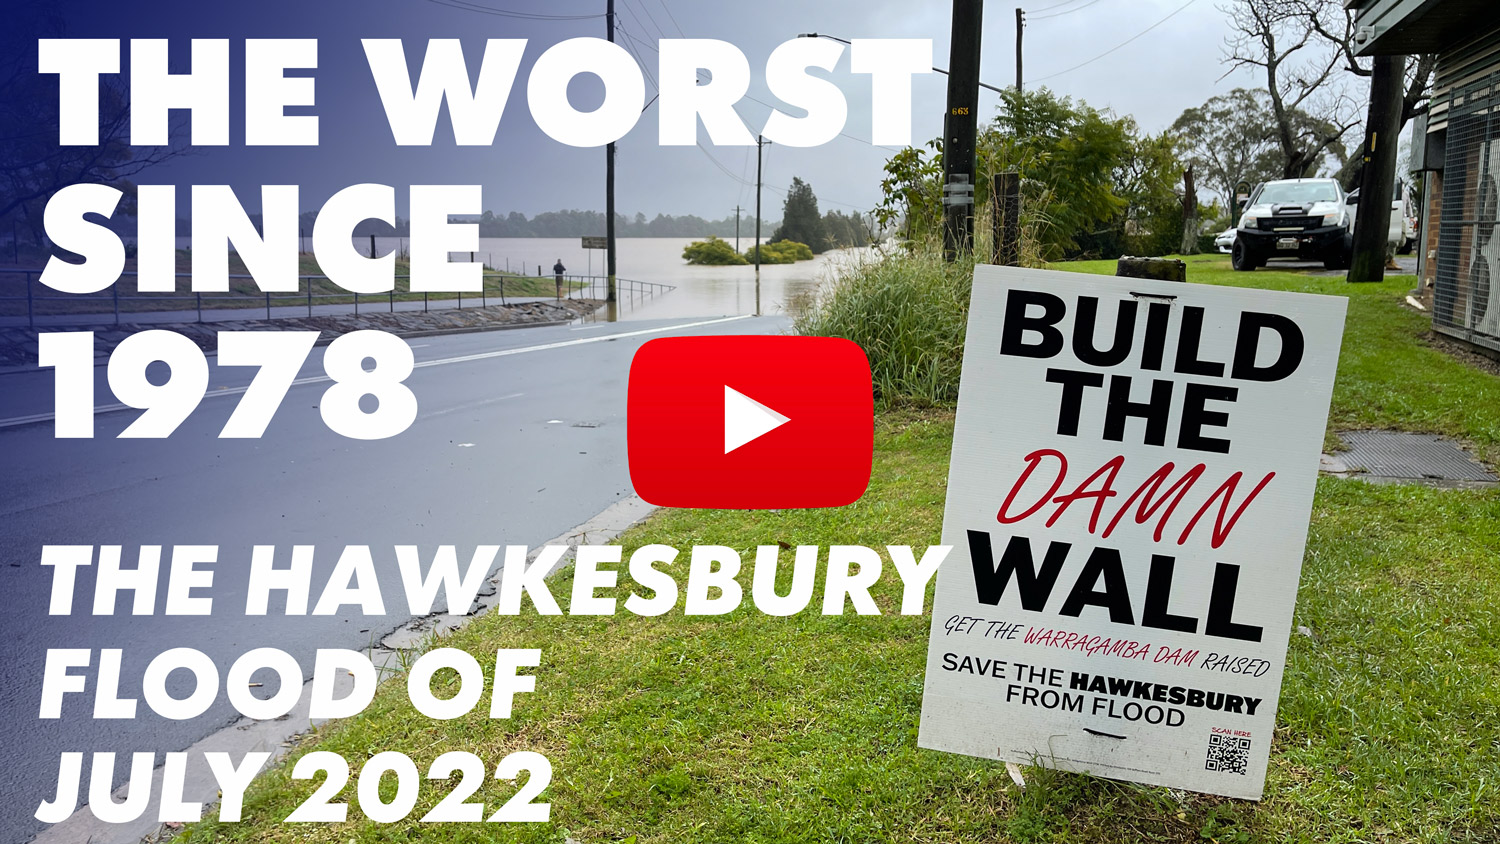
The Hawkesbury-Nepean flood of July 2022 – the worst since 1978
|
|
|
|
|
|
|
The above video shows some truly extraordinary imagery of the extent of the floodwaters around the Hawkesbury. Floating cars at the Crowne Plaza, the entire basement carpark of the Riverview shops in Windsor flooded, Windsor Toyota underwater, and street after street in McGraths Hill, Pitt Town, Oakville and elsewhere filled with water.
|
If there's any grim solace, it is that our agencies and support networks are now more experienced and know what help is needed and where. Our profound thanks are owed to the SES, RFS, Police, evacuation centre staff, Council employees, charitable groups like Hawkesbury's Helping Hands, and essential responders doing things like rescue, repairing the electrical grid, directing evacuation routes and commencing the massive job of assessment and cleanup.
|
|
|
|
|
|
Clearing up misunderstandings about flooding
|
|
|
|
I hear many questions repeated over in the important public debate we need to have about how we should respond to the long term increase in flood risk.
|
- Why wasn't the water from Warragamba dam drawn down before this rain event arrived?
- For that matter, why isn't it the dam operated permanently at a lower level?
- Isn't the effect of operating the dam at a lower level just as good for flood mitigation as seeking to raise the dam?
- What difference would raising or lowering the dam make to flood heights and evacuation times?
- Isn't the drive to raise the dam really about increased urban development on the floodplain?
- Woudn't they just fill a raised dam back to the top anyway?
- Why bother focusing on Warragamba, when there are other tributary rivers that feed into the floodplain?
The operation of Warragamba Dam
Warragamba is not a flood mitigation dam. It was built as a water storage dam in 1960 and legally cannot be deliberately operated below capacity in the sense of dumping water overboard just before a rain event, or permanently operating it at a lower level.
|
This is unlike other dams like Wivenhoe Dam in Brisbane which has a permanent 'air gap' to act as a buffer in times of flood. Wivenhoe's water storage capacity is 1160 gigalitres, but its air gap is a further 1967 gigalitres. In other words, two thirds of its capacity is a flood buffer.
|
Warragamba's current capacity is 2031 gigalitres, but when it's full, the flood buffer is zero. The plan to raise it by ~14m would add about 1000 gigalitres of emergency storage, used rarely.
|
Some have argued that the water level could be drawn down from 100% as soon as an East Coast Low is expected. Others argue the permanent level of the dam should be lowered and that this is equivalent to the kind of mitigation that raising the dam would confer.
|
I agree that the Government should look at the rules restricting flexibility in the operation of the dam, but it's important to understand it is not the fix we're looking for.
|
Neither strategy would confer a sufficient degree of mitigation to be worthwhile:
|
|

|
Flood height reductions with various mitigation strategies (source)
|
If the dam level had been drawn down just before the 2021 flood, the resulting flood height would have been only 20cm lower. Worse, emergency pre-rain-bomb releases could cause localised flooding and shorten the time available to evacuate livestock, equipment and families.
|
If the dam was permanently kept lower by as much as 5m, it would have made only a 60cm difference. Had the water supply been lowered by 5 metres in 2016 for example, the dam would have dropped to 26% in February 2020 at the end of that drought – a critically low level, even lower than during the Millennium drought when the storage reached 32%.
|
A permanent 12m reduction would erase 40% of Sydney's drinking water and require the desalination plant to run continuously, which costs over $195M a year to run, even when idle.
|
The shape of the valley the dam occupies is shaped like a wine glass. Lower levels hold much less water. Lowering the dam level would mitigate far, far less than raising it by the same amount.
|
In contrast, if a raised dam had already been in place, 500 of the 600 houses flooded along the Hawkesbury-Nepean floodplain in the March 2021 would have been spared, since that flood would have been 3.4m lower. And outflows would have been delayed by only 3-4 days, meaning a negligible impact on the ecology surrounding the dam (source).
|
In still-larger floods, the degree of protection grows further: The March 2022 flood drowned over a thousand houses, and there are 5000 houses below the 1:100 level - including historic suburbs built before there were any such a thing as flood height controls.
|
Those who oppose all measures to reduce the height of future floods have an onus to look those families in the eye and tell them that they shouldn't be protected.
|
Is this really just a smokescreen about development?
|
Supporting the raising of Warragamba dam is about helping to protect the lives and property of the 140,000 people who live and trade on the floodplain.
|
|
I have been a trenchant critic of inappropriate development for years, and I would not support the project if it was about more houses.
|
|
I don't like 'ant-hill' Sydney, and I loathe the entanglement of developer interests in politics.
|
I want to preserve our rural lands for agriculture, acreage living, equine uses, and passive recreation. Here are two examples of my stance:
|
|
|
|
|
|
Many critics of raising the dam claim the project is a stalking horse for extra development on the floodplain. However, all the plans, reports and even testimony before Parliamentary inquiries prove that this isn't the case.
|
Not a single square inch of land that is currently sterilised for development due to flood height controls would be built on if the dam were raised. Flood height controls would remain at the same level (source). The plans also attest that a raised dam would be operated at no more than the present 100% level and would not be used for extra drinking supply. To do so would miss the point. Development above the 1:100 level is and will remain legal.
|
Are the risks really increasing?
I appreciate there are strong views about the reality and remedies of climate change. But I am a high school teacher who teaches critical thinking. What I teach young people is that we should always follow the science, and prefer peer-reviewed, data-driven conclusions over polemic.
|
I have some sympathy with the views of scholars like Jamie Pittock who say that even a “medium” climate change scenario will see a 14.6% increase in rainfall by 2090 west of Sydney, increasing the 1:100 year flood height at Windsor from 17.3m to 18.4m.
|
Climate modelling shows the risks of a major flood, similar to that seen in 1867 is higher now than ever before. This is backed by research conducted by the CSIRO in 2007 and by the University of Sydney in 2021.
|
|
|
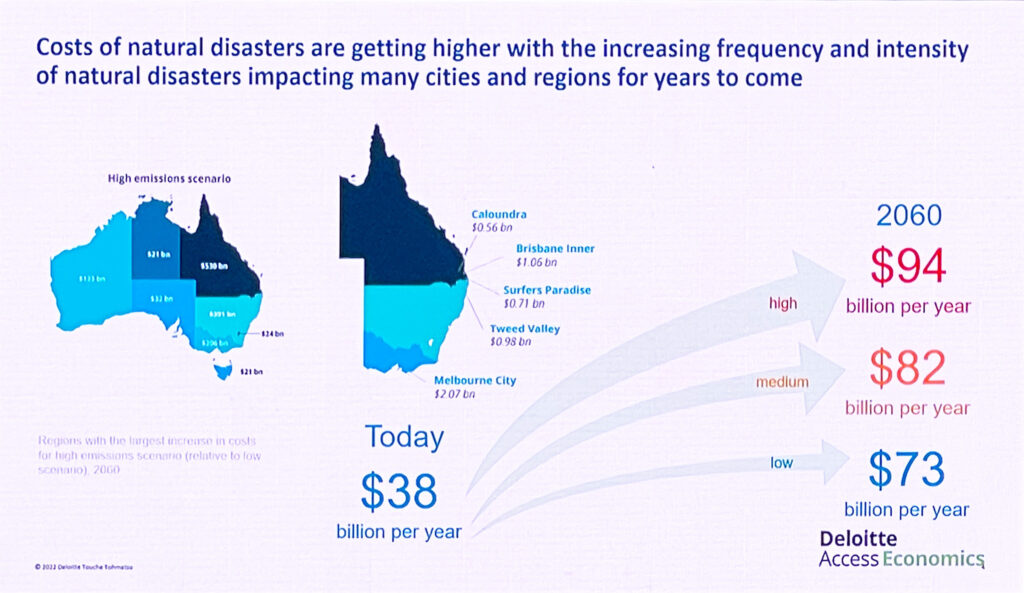
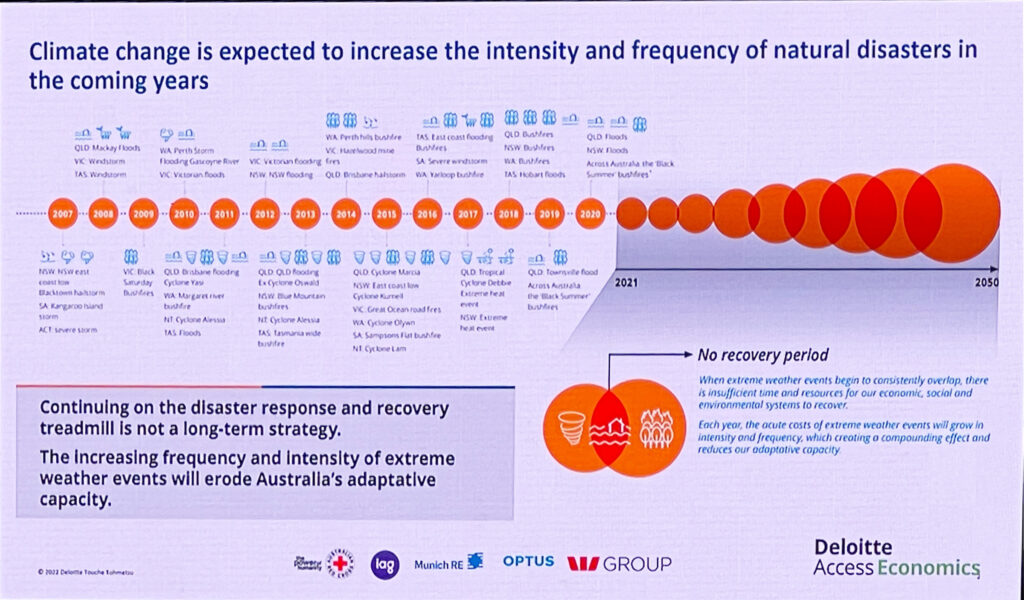
Recently I attended the Australian Local Government Association conference in Canberra and learned that the annual cost of natural disasters to Australia is presently $38 billion a year, and could rise to $94B p.a by 2060, depending on the approach we take to mitigate risk, adapt and build the resilience of our communities. These slides were presented at the conference.
|
|
|
But what about other sources of flooding?
|
Some people claim that, because any particular flood has contributions from other tributary rivers, it is wrong to focus on Warragamba.
|
|

|
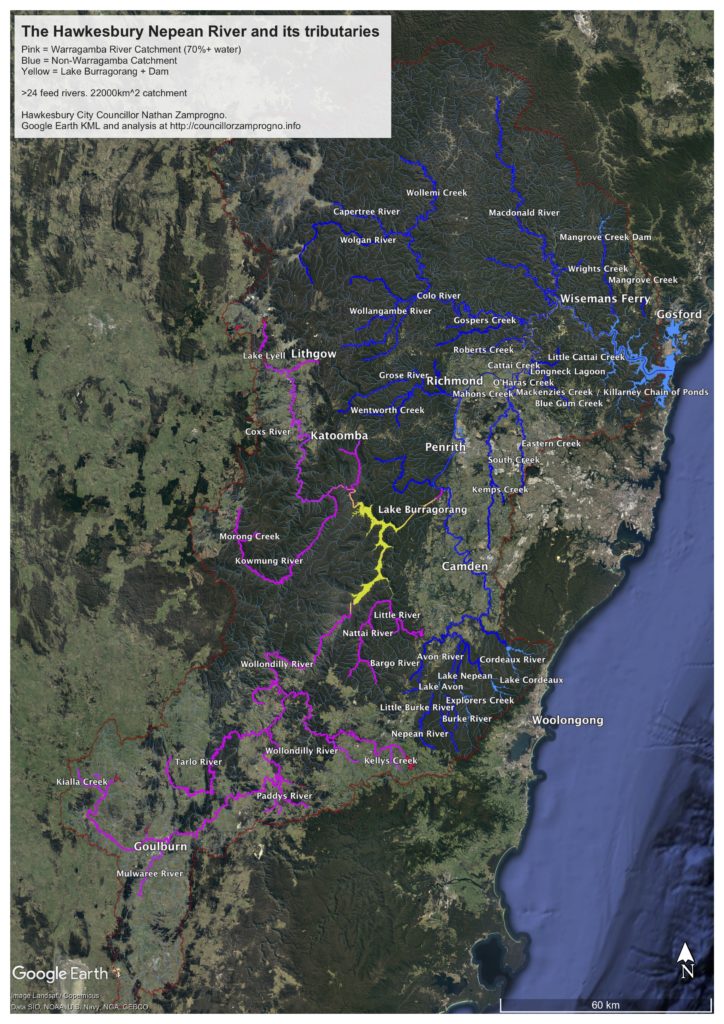
However, as the above graph shows (source), on average, 70% of all floodwaters (and 80% of the catchment land area) originate upstream of the dam. The fact that the Nepean, Colo, Grose or Macdonald Rivers, all of which lay below the dam, make a greater or lesser contribution in any one flood does not change the overall picture. Raising Warragamba is the best bang-for-buck. This includes modelling the impact of building levees, widening the chokepoints at Sackville, dredging the river and building more dams elsewhere in the catchment.
|
|
The short version is this: In the map below, Warragamba dam is yellow, the upstream rivers are purple and the downstream rivers are blue.
|
|
|
|
|
|
|
|
Our discussion needs to look at the bigger picture
|
|
|
|
Raising Warragamba Dam is a necessary part of a larger strategy to reduce the risk of future flooding and to build resilience in our communities.
|
The Flood Emergency Plan our Council adopted in 2020 listed the maintenance of effective evacuation routes as a critical priority. I note a commitment of $5M in the new NSW State Budget as a step towards that goal.
|
Preparedness also involves planning codes that discourage inappropriate development on the floodplain and community education.
|
It was a mistake in my opinion for NSW Planning Minister Anthony Roberts to rescind his predecessor Rob Stokes' policy of ensuring that the risks of floods and fires were taken into account when building new homes. The axe fell on the policy of considering nine principles for sustainable development in March. Since then we have had two devastating floods. The Minister's decision has not aged well.
|
The need for Government to commit to bold action is urgent and growing.
|
We have a strong moral duty to act, and I am fatigued by people who do not share the risk our community endures telling us that it isn't worth doing.
|
For an excellent "big picture" review of many of these issues, let me commend a very recent and prescient Sky News Australia special report into flooding on the Hawkesbury Nepean River. The link is the image below:
|
|
|
|
|
|
|
|
|
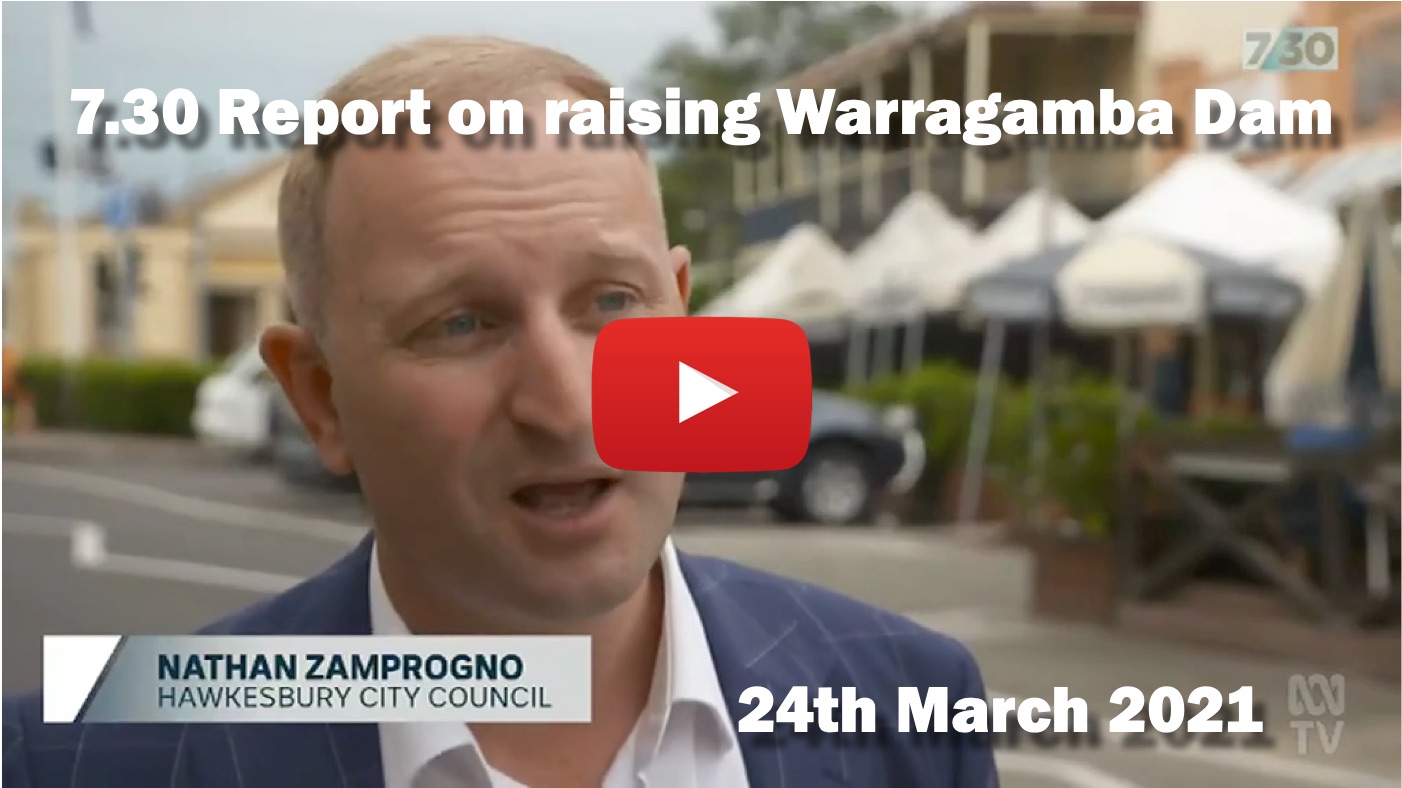
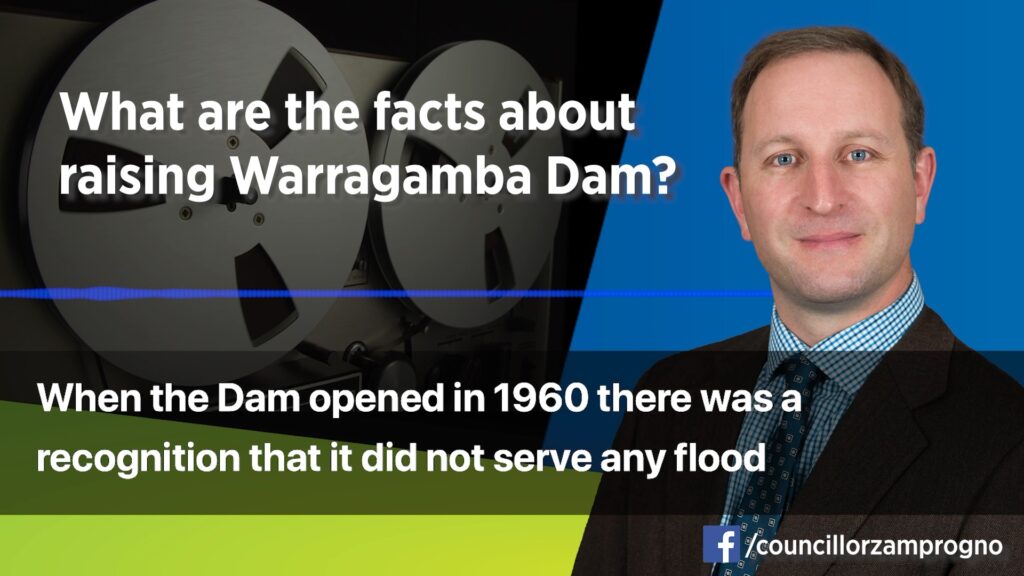
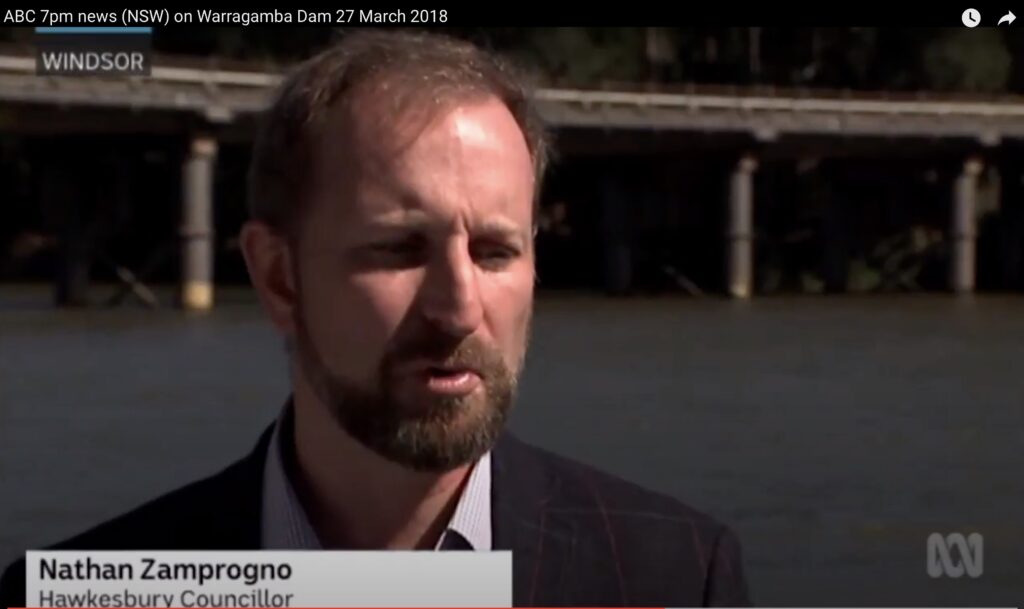
I've been warning and advocating about this for many years. For other interviews I have done on radio and TV, see the links below:
|
|
|
|
|
|
|
|
|
|
|
|
|