Watch the brief explainer video by clicking above.
Visualising 30 years of data comparing NSW Councils from the Office of Local Government
JULY 2026 Update: This interactive tool has now been updated with the FY 2025-2025 data from the NSW Office of Local Government.
2026-2029 projections are accurate for all Councils with active Special Rate Variation programs operating over those years. For all other Councils, the likely rate-peg applies.
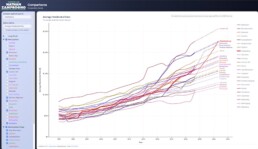
How does your Council compare to all other Councils in New South Wales? The NSW Office of Local Government has 30 years of spreadsheets that hold the raw data that answer that question, but no one I’ve found has bothered to correlate it and turn it into graphs. I am happy to offer this analysis for all NSW residents and Councillors. I focus on my own Council in the Hawkesbury district, but the website allows you to compare any LGA against any others. You can find the interactive graphs at by clicking below, or watch the summary video by clicking above.